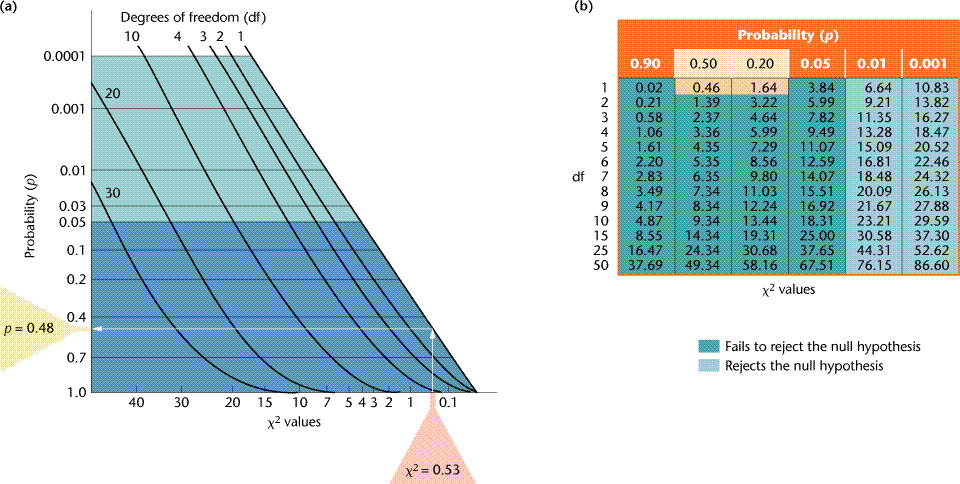
Χ2 values greater than those shown at p = 0.05 fail to reject the
null hypothesis,
while Χ2 values less than those at p = 0.05 justify rejecting the
null hypothesis.
In our example, Χ2 = 0.53 for 1 df is converted to a p value between 0.20 and 0.50.
The graph in (a) provides an estimated p value of 0.48 by interpolation.
In this case, we fail to reject the null hypothesis.
